I’ve started working with Python (2.7 and 3.x) and OpenCV 3 recently, and the IPython Notebook way of working with inline plots is awesome. But the debugging, editing and some other features are not great when compared to working in a Visual Studio environment.
So now I’m trying Visual Studio 2013 as the IDE, OpenCV 3, and Python 2.7 via the numerical and scientific WinPython stack.
I extracted OpenCV and WinPython to:
- My Documents\OpenCV
- My Documents\WinPython-32bit-2.7.10.2
From VS2013 I then installed Python Tools for Visual Studio (PTVS).. I did this within VS2013 using the Extensions and Tools dialog.
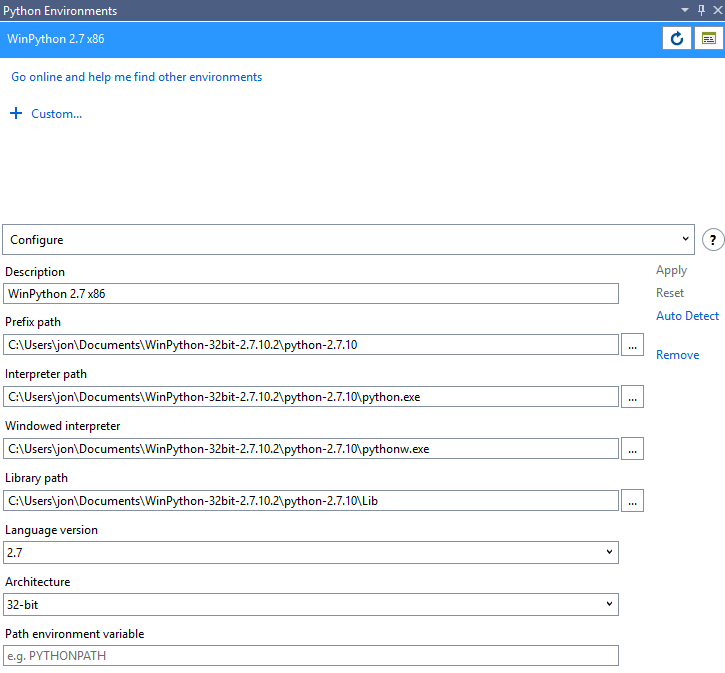
Finally I configured a new Python Environment:
From an Interactive Window I can then check everything works as expected. First, Open CV3:
Python interactive window. Type $help for a list of commands.
import cv2
cv2.__version__
'3.0.0'
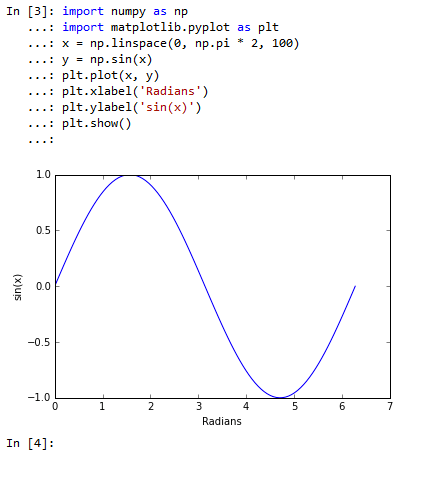
Next up, NumPy and a MatPlotLib chart:
import numpy as np
import matplotlib.pyplot as plt
x = np.linspace(0, np.pi * 2, 100)
y = np.sin(x)
plt.plot(x, y)
plt.xlabel('Radians')
plt.ylabel('sin(x)')
plt.show()
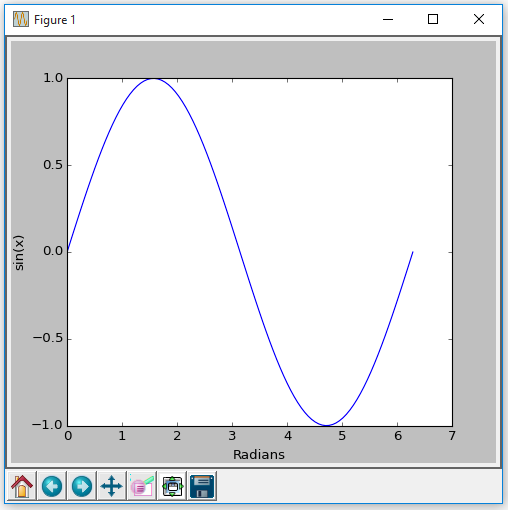
This gives us a popup (model) window:
Now to make it a bit more interesting – inline plots.. ! The Python Interactive Window has options for the Interactive mode:

The default Interactive Mode is Standard but we can change this to IPython:

After restarting VS2013 we can now go inline…
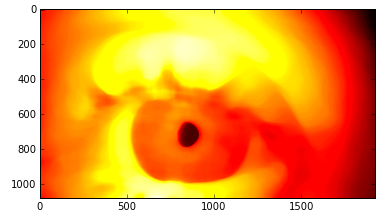
And lastly an OpenCV 3 test:
In [4]: import cv2
In [5]: img = cv2.imread(r"C:\Users\jon\Pictures\Samples\eye.jpg", 0)
In [6]: plt.imshow(img, cmap='gray')
Out[6]: <matplotlib.image.AxesImage at 0x5b8e510>

In [34]: blur = cv2.medianBlur(img, 91)
In [35]: plt.imshow(blur, cmap='hot')
Out[35]: <matplotlib.image.AxesImage at 0x1edea7d0>
The great thing is I can now move this code into a Python project, get it into git, distribute among colleagues, and use the excellent intellisense and debugging powers of PTVS ! (Obviously not this actual code !)
